Mouse 3D MR minimum deformation atlas

Filed under: Datasets

By accessing this data, you agree to the terms of the MouseBIRN Data Use Agreement.

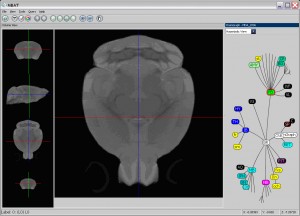
This atlas is constructed from T2-weighted magnetic resonance microscopy (MRM) images acquired from 11 normal female C57BL/6J mice and is the default atlas for the Mouse BIRN Atlasing Toolkit (MBAT).

Description

MRM.  Mice were anesthetized initially with ketamine/xylzaine and then maintained on isofluorane for the duration of the imaging experiment.  Magnetic resonance imaging was done at 37° C using an 89 mm vertical bore 11.7 T Bruker Avance imaging spectrometer with a micro-imaging gradient insert and 30 mm birdcage RF coil (Bruker Instruments).  Typical imaging parameters were as follows:  T2-weighted RARE 3D imaging protocol (8 echoes), matrix dimensions = 256 x 256 x 256; FOV = 3 cm x 1.5 cm x 1.5; repetition time (TR) = 1500 ms; effective time (TE) = 10 ms; number of averages = 4. The images were padded with zeros to double the number of time domain points in each dimension, the Fourier transformed to yield a matrix of 512 x 256 x 256.  This procedure is commonly called “zero-filling” and is a well known interpolation method (Farrar and Becker, 1971; Fukushima and Roeder, 1981). Typical spatial resolution was approximately 60 µm3 per voxel.

Nomenclature and Delineations.  Neural structures (including cell groups, fiber tracts and gross anatomical features such as the ventricles) were determined under the microscope from the histologically stained sections.  3D label volumes were “painted” onto coregistered MRM, Nissl-, myelin-, and acetylcholine esterase-stained volumes using BrainSuite (Shattuck and Leahy, 2002). The delineations depict asymmetries present in the sections, making them more immediately useful than if they were stylized.  Delineation of brain nuclei requires an expert neuroanatomist to draw on high-level knowledge, accumulated over a lifetime of careful study of disparate materials (Swanson, 1998).  Consequently, manual input was necessary for even approximate parcellation of brain in its fine details.  In the development of a comprehensive, standardized, and mutually exclusive nomenclature (Bowden and Martin, 1995; Bard et al., 1998) and anatomic delineation, our primary references were the mouse brain atlas of Paxinos and Franklin (Paxinos and Franklin, 2001) and the rat brain atlas of Swanson ( Swanson, 2004).

mouse_mda

Usage

This atlas volume can be viewed using the Mouse BIRN Atlasing Tool (MBAT) or SHIVA.  See the respective manuals for these programs.

To get more information about MBAT, see http://www.loni.ucla.edu/Software/MBAT

For more information about SHIVA, see http://www.loni.ucla.edu/Software/Software_Detail.jsp?software_id=12

Accession Number

TBD

Download

http://www.loni.ucla.edu/Atlases/Atlas_Detail.jsp?atlas_id=18

Data are compressed and combined into a single tar for download. Unzip these before viewing. Mac users can automatically unzip these files, or a program may be used such as winzip (http://www.winzip.com/index.htm) for Windows or gzip (http://www.gzip.org/) for Unix. To view volumes in MBAT, select “Open Data” and select the file in the Open dialogue. To view .atlas or .keg files in MBAT select the “Open Atlas” option and select the file in the Open dialogue.

For more information about MBAT visit http://mbat.loni.ucla.edu/

Contributors/Authors

Allan MacKenzie-Graham1, Matthew R. Tinsley 2, Kaanan P. Shah1, Cynthia Aguilar1, Lauren V. Strickland1, Jyl Boline1, Melanie Martin3, Laurie Morales4 , David W. Shattuck1, Russell E. Jacobs5, Rhonda R. Voskuhl4, and Arthur W. Toga1

  1. Laboratory of Neuro Imaging, Department of Neurology, University of California, Los Angeles.
  2. Department of Psychology, University of California, Los Angeles.
  3. Department of Physics, University of Winnipeg.
  4. Multiple Sclerosis Program, Department of Neurology, University of California, Los Angeles.
  5. Beckman Institute, California Institute of Technology.

Citations

  • MacKenzie-Graham, A., Tinsley, M.R., Shah, K.P., Aguilar, C., Strickland, L.V., Boline, J., Martin, M., Morales, L., Shattuck, D.W., Jacobs, R.E., Voskuhl, R.R., and Toga, A.W.  (2006)  Cerebellar Cortical Atrophy in Experimental Autoimmune Encephalomyelitis.  Neuroimage, 32(3):1016-23.
  • Please acknowledge the contributors and the mouse BIRN.

Technical Contacts

Allan MacKenzie-Graham amg *AT* ucla.edu

Acknowledgements

This work was generously supported by a research grant from NCRR U24 RR021760 (AWT), NIH U54 RR 021813 (AWT), NMSS CA 1028 (RRV), NMSS RG 3593 (RRV), and NMSS PP 1098 (RRV).

BIRN is supported by NIH grants 1U24-RR025736, U24-RR021992, U24-RR021760 and by the Collaborative Tools Support Network Award 1U24-RR026057-01.
 
Mouse 3D MR minimum deformation atlas | Biomedical Informatics Research Network (BIRN)

Mouse 3D MR minimum deformation atlas

Filed under: Datasets

By accessing this data, you agree to the terms of the MouseBIRN Data Use Agreement.

This atlas is constructed from T2-weighted magnetic resonance microscopy (MRM) images acquired from 11 normal female C57BL/6J mice and is the default atlas for the Mouse BIRN Atlasing Toolkit (MBAT).

Description

MRM.  Mice were anesthetized initially with ketamine/xylzaine and then maintained on isofluorane for the duration of the imaging experiment.  Magnetic resonance imaging was done at 37° C using an 89 mm vertical bore 11.7 T Bruker Avance imaging spectrometer with a micro-imaging gradient insert and 30 mm birdcage RF coil (Bruker Instruments).  Typical imaging parameters were as follows:  T2-weighted RARE 3D imaging protocol (8 echoes), matrix dimensions = 256 x 256 x 256; FOV = 3 cm x 1.5 cm x 1.5; repetition time (TR) = 1500 ms; effective time (TE) = 10 ms; number of averages = 4. The images were padded with zeros to double the number of time domain points in each dimension, the Fourier transformed to yield a matrix of 512 x 256 x 256.  This procedure is commonly called “zero-filling” and is a well known interpolation method (Farrar and Becker, 1971; Fukushima and Roeder, 1981). Typical spatial resolution was approximately 60 µm3 per voxel.

Nomenclature and Delineations.  Neural structures (including cell groups, fiber tracts and gross anatomical features such as the ventricles) were determined under the microscope from the histologically stained sections.  3D label volumes were “painted” onto coregistered MRM, Nissl-, myelin-, and acetylcholine esterase-stained volumes using BrainSuite (Shattuck and Leahy, 2002). The delineations depict asymmetries present in the sections, making them more immediately useful than if they were stylized.  Delineation of brain nuclei requires an expert neuroanatomist to draw on high-level knowledge, accumulated over a lifetime of careful study of disparate materials (Swanson, 1998).  Consequently, manual input was necessary for even approximate parcellation of brain in its fine details.  In the development of a comprehensive, standardized, and mutually exclusive nomenclature (Bowden and Martin, 1995; Bard et al., 1998) and anatomic delineation, our primary references were the mouse brain atlas of Paxinos and Franklin (Paxinos and Franklin, 2001) and the rat brain atlas of Swanson ( Swanson, 2004).

mouse_mda

Usage

This atlas volume can be viewed using the Mouse BIRN Atlasing Tool (MBAT) or SHIVA.  See the respective manuals for these programs.

To get more information about MBAT, see http://www.loni.ucla.edu/Software/MBAT

For more information about SHIVA, see http://www.loni.ucla.edu/Software/Software_Detail.jsp?software_id=12

Accession Number

TBD

Download

http://www.loni.ucla.edu/Atlases/Atlas_Detail.jsp?atlas_id=18

Data are compressed and combined into a single tar for download. Unzip these before viewing. Mac users can automatically unzip these files, or a program may be used such as winzip (http://www.winzip.com/index.htm) for Windows or gzip (http://www.gzip.org/) for Unix. To view volumes in MBAT, select “Open Data” and select the file in the Open dialogue. To view .atlas or .keg files in MBAT select the “Open Atlas” option and select the file in the Open dialogue.

For more information about MBAT visit http://mbat.loni.ucla.edu/

Contributors/Authors

Allan MacKenzie-Graham1, Matthew R. Tinsley 2, Kaanan P. Shah1, Cynthia Aguilar1, Lauren V. Strickland1, Jyl Boline1, Melanie Martin3, Laurie Morales4 , David W. Shattuck1, Russell E. Jacobs5, Rhonda R. Voskuhl4, and Arthur W. Toga1

  1. Laboratory of Neuro Imaging, Department of Neurology, University of California, Los Angeles.
  2. Department of Psychology, University of California, Los Angeles.
  3. Department of Physics, University of Winnipeg.
  4. Multiple Sclerosis Program, Department of Neurology, University of California, Los Angeles.
  5. Beckman Institute, California Institute of Technology.

Citations

  • MacKenzie-Graham, A., Tinsley, M.R., Shah, K.P., Aguilar, C., Strickland, L.V., Boline, J., Martin, M., Morales, L., Shattuck, D.W., Jacobs, R.E., Voskuhl, R.R., and Toga, A.W.  (2006)  Cerebellar Cortical Atrophy in Experimental Autoimmune Encephalomyelitis.  Neuroimage, 32(3):1016-23.
  • Please acknowledge the contributors and the mouse BIRN.

Technical Contacts

Allan MacKenzie-Graham amg *AT* ucla.edu

Acknowledgements

This work was generously supported by a research grant from NCRR U24 RR021760 (AWT), NIH U54 RR 021813 (AWT), NMSS CA 1028 (RRV), NMSS RG 3593 (RRV), and NMSS PP 1098 (RRV).

BIRN is supported by NIH grants 1U24-RR025736, U24-RR021992, U24-RR021760 and by the Collaborative Tools Support Network Award 1U24-RR026057-01.
 
Mouse 3D MR minimum deformation atlas | Biomedical Informatics Research Network (BIRN)

Mouse 3D MR minimum deformation atlas

Filed under: Datasets

By accessing this data, you agree to the terms of the MouseBIRN Data Use Agreement.

This atlas is constructed from T2-weighted magnetic resonance microscopy (MRM) images acquired from 11 normal female C57BL/6J mice and is the default atlas for the Mouse BIRN Atlasing Toolkit (MBAT).

Description

MRM.  Mice were anesthetized initially with ketamine/xylzaine and then maintained on isofluorane for the duration of the imaging experiment.  Magnetic resonance imaging was done at 37° C using an 89 mm vertical bore 11.7 T Bruker Avance imaging spectrometer with a micro-imaging gradient insert and 30 mm birdcage RF coil (Bruker Instruments).  Typical imaging parameters were as follows:  T2-weighted RARE 3D imaging protocol (8 echoes), matrix dimensions = 256 x 256 x 256; FOV = 3 cm x 1.5 cm x 1.5; repetition time (TR) = 1500 ms; effective time (TE) = 10 ms; number of averages = 4. The images were padded with zeros to double the number of time domain points in each dimension, the Fourier transformed to yield a matrix of 512 x 256 x 256.  This procedure is commonly called “zero-filling” and is a well known interpolation method (Farrar and Becker, 1971; Fukushima and Roeder, 1981). Typical spatial resolution was approximately 60 µm3 per voxel.

Nomenclature and Delineations.  Neural structures (including cell groups, fiber tracts and gross anatomical features such as the ventricles) were determined under the microscope from the histologically stained sections.  3D label volumes were “painted” onto coregistered MRM, Nissl-, myelin-, and acetylcholine esterase-stained volumes using BrainSuite (Shattuck and Leahy, 2002). The delineations depict asymmetries present in the sections, making them more immediately useful than if they were stylized.  Delineation of brain nuclei requires an expert neuroanatomist to draw on high-level knowledge, accumulated over a lifetime of careful study of disparate materials (Swanson, 1998).  Consequently, manual input was necessary for even approximate parcellation of brain in its fine details.  In the development of a comprehensive, standardized, and mutually exclusive nomenclature (Bowden and Martin, 1995; Bard et al., 1998) and anatomic delineation, our primary references were the mouse brain atlas of Paxinos and Franklin (Paxinos and Franklin, 2001) and the rat brain atlas of Swanson ( Swanson, 2004).

mouse_mda

Usage

This atlas volume can be viewed using the Mouse BIRN Atlasing Tool (MBAT) or SHIVA.  See the respective manuals for these programs.

To get more information about MBAT, see http://www.loni.ucla.edu/Software/MBAT

For more information about SHIVA, see http://www.loni.ucla.edu/Software/Software_Detail.jsp?software_id=12

Accession Number

TBD

Download

http://www.loni.ucla.edu/Atlases/Atlas_Detail.jsp?atlas_id=18

Data are compressed and combined into a single tar for download. Unzip these before viewing. Mac users can automatically unzip these files, or a program may be used such as winzip (http://www.winzip.com/index.htm) for Windows or gzip (http://www.gzip.org/) for Unix. To view volumes in MBAT, select “Open Data” and select the file in the Open dialogue. To view .atlas or .keg files in MBAT select the “Open Atlas” option and select the file in the Open dialogue.

For more information about MBAT visit http://mbat.loni.ucla.edu/

Contributors/Authors

Allan MacKenzie-Graham1, Matthew R. Tinsley 2, Kaanan P. Shah1, Cynthia Aguilar1, Lauren V. Strickland1, Jyl Boline1, Melanie Martin3, Laurie Morales4 , David W. Shattuck1, Russell E. Jacobs5, Rhonda R. Voskuhl4, and Arthur W. Toga1

  1. Laboratory of Neuro Imaging, Department of Neurology, University of California, Los Angeles.
  2. Department of Psychology, University of California, Los Angeles.
  3. Department of Physics, University of Winnipeg.
  4. Multiple Sclerosis Program, Department of Neurology, University of California, Los Angeles.
  5. Beckman Institute, California Institute of Technology.

Citations

  • MacKenzie-Graham, A., Tinsley, M.R., Shah, K.P., Aguilar, C., Strickland, L.V., Boline, J., Martin, M., Morales, L., Shattuck, D.W., Jacobs, R.E., Voskuhl, R.R., and Toga, A.W.  (2006)  Cerebellar Cortical Atrophy in Experimental Autoimmune Encephalomyelitis.  Neuroimage, 32(3):1016-23.
  • Please acknowledge the contributors and the mouse BIRN.

Technical Contacts

Allan MacKenzie-Graham amg *AT* ucla.edu

Acknowledgements

This work was generously supported by a research grant from NCRR U24 RR021760 (AWT), NIH U54 RR 021813 (AWT), NMSS CA 1028 (RRV), NMSS RG 3593 (RRV), and NMSS PP 1098 (RRV).

BIRN is supported by NIH grants 1U24-RR025736, U24-RR021992, U24-RR021760 and by the Collaborative Tools Support Network Award 1U24-RR026057-01.